When most people hear the term ‘Web Analytics’, the first thing they think of is Google Analytics. And why wouldn’t they; after all more than 80% of people use Google Analytics for their web! But that’s just one component of Analytics. In this exclusive series on TheRodinhoods, I will be sharing my thoughts on how users can use analytics for learning more about their web visitors.
This first article is on Visual Analytics.
As a website owner, we tend to lean more towards traditional analytics i.e. looking into transitions by users on the web pages. Nothing wrong with that. It is one of the ways to capture the user’s navigation pattern. But to me, that’s limited information. Indeed it would be interesting to know the user behaviour on each page and if possible, the interaction which the user makes with each element on the page. Let’s discuss more on how we can extend data learning from web visitors.
Analysing Click Tracks
One of the most efficient ways to implant visual analytics on a website is by understanding Click Tracks. Understanding click patterns will allow the web master to gain true insights into user intent. The strategic optimization can result in better user-experience, engagement and sales. But how does one achieve this?
As a web owner, it is important to know which areas in your page draw the visitor’s attention.
Imagine your site is running a contest and you’ve put all the graphics on the site indicating the same. But are visitors going to that specific part of the page that you want them to go to? A mouse move heat map of the page could be the ideal way to understand how their entire journey takes shape. This will analyse which section of the page users are engaging with the most.
Study the mouse heatmap
Irrespective of the way the page is displayed, the heat map will show how customers are interacting with your page. Using mouse move heat map, you’ll see “heat” for the precise elements over which the mouse pointer is moved or hovered by user. This heat study will help you understand if you need to redesign a certain element on a page to help draw the visitor’s attention to it.
Consider this case of Real Network done using ClickTale analytics. The header showed a link “One-Click Video Download” without the key call-to-action which made users to click AROUND the link without yielding noticeability.
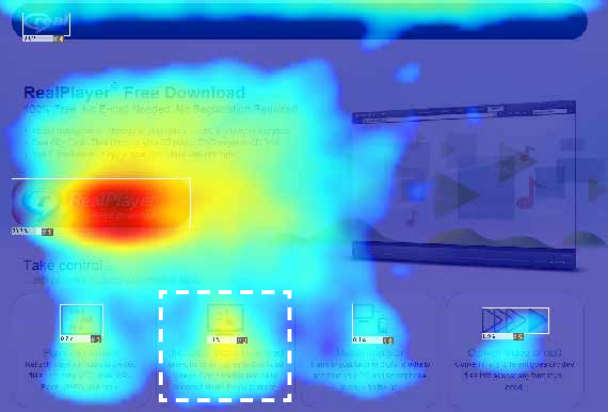
Fig 1: Case study done using ClickTale
But soon after the key call-to-action was highlighted (after understanding the user’s mouse click pattern), this led to an increase of 5% in visitors downloading RealPlayer
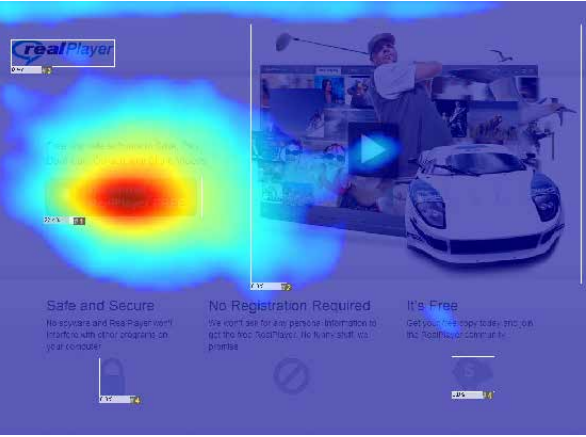
Fig 2: Case study done using ClickTale
Capturing every mouse movement such as scroll, click, highlight, etc. can help us understand the intent of the user.
Surface Area coverage heat map
One of the finer ways to analyse this data is to discover where your users expect to go on their journey. Probably understanding which areas of the page they are engaging with most and at what time, could be some of the ways you can understand this big data. With deep insights into what they’re aiming for, it’s easy to help them take the next step.
Like for example, something they are clicking on the page might look like a button to them, but which in reality is not a button. Since they are presuming it’s a button, it needs to undergo either a location change or better design to ensure it DOES NOT resemble a button.
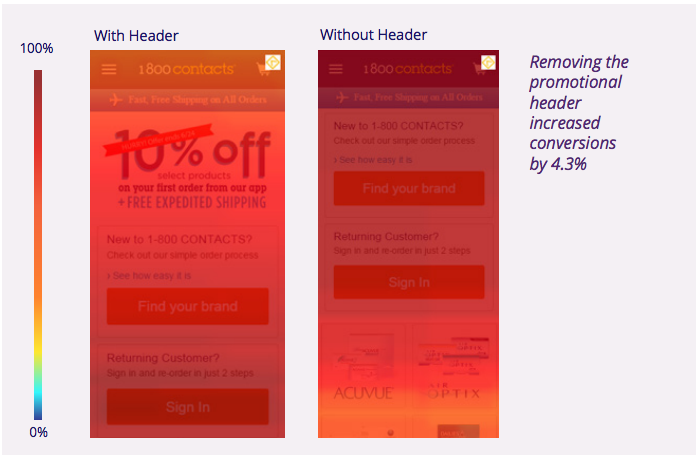
Fig 3: Case study done using ClickTale
The other way to co-relate this analytic would be to figure out which section of the page the user pays maximum attention. Depending on this analytic, you can move the content to that area or remove some content from wherever there is low interaction.
Suppose you have placed a great call-to-action button towards the bottom of the page and it goes unnoticed. A good way to understand this would be to find out how low the user scrolls down to. One of the case studies on 1-800Contacts shows drastic conversions when the study of attention heat map yielded greater conversion. Take a look at the image above. 1-800Contacts analyzed heat maps with aggregated insights into customer attention and scrolling behavior. With the header on the page, the analytic showed that, not enough users were scrolling down the page. By removing the header,
1-800Contacts achieved 4.3% additional conversions and thus substantially increasing revenues.
Though there are plenty tools available in the market, I would highly recommend using these two
- ClickTale: https://www.clicktale.com
- CrazyEgg: https://crazyegg.com
Stay tuned for the next edition of Into the Web Analytics War Room.
Do get in touch with me on Twitter ( @prajyotm) and Facebook ( /Prajyotmainkar)
****
The next article is on Form Analytics. Do check it out here.
*****