

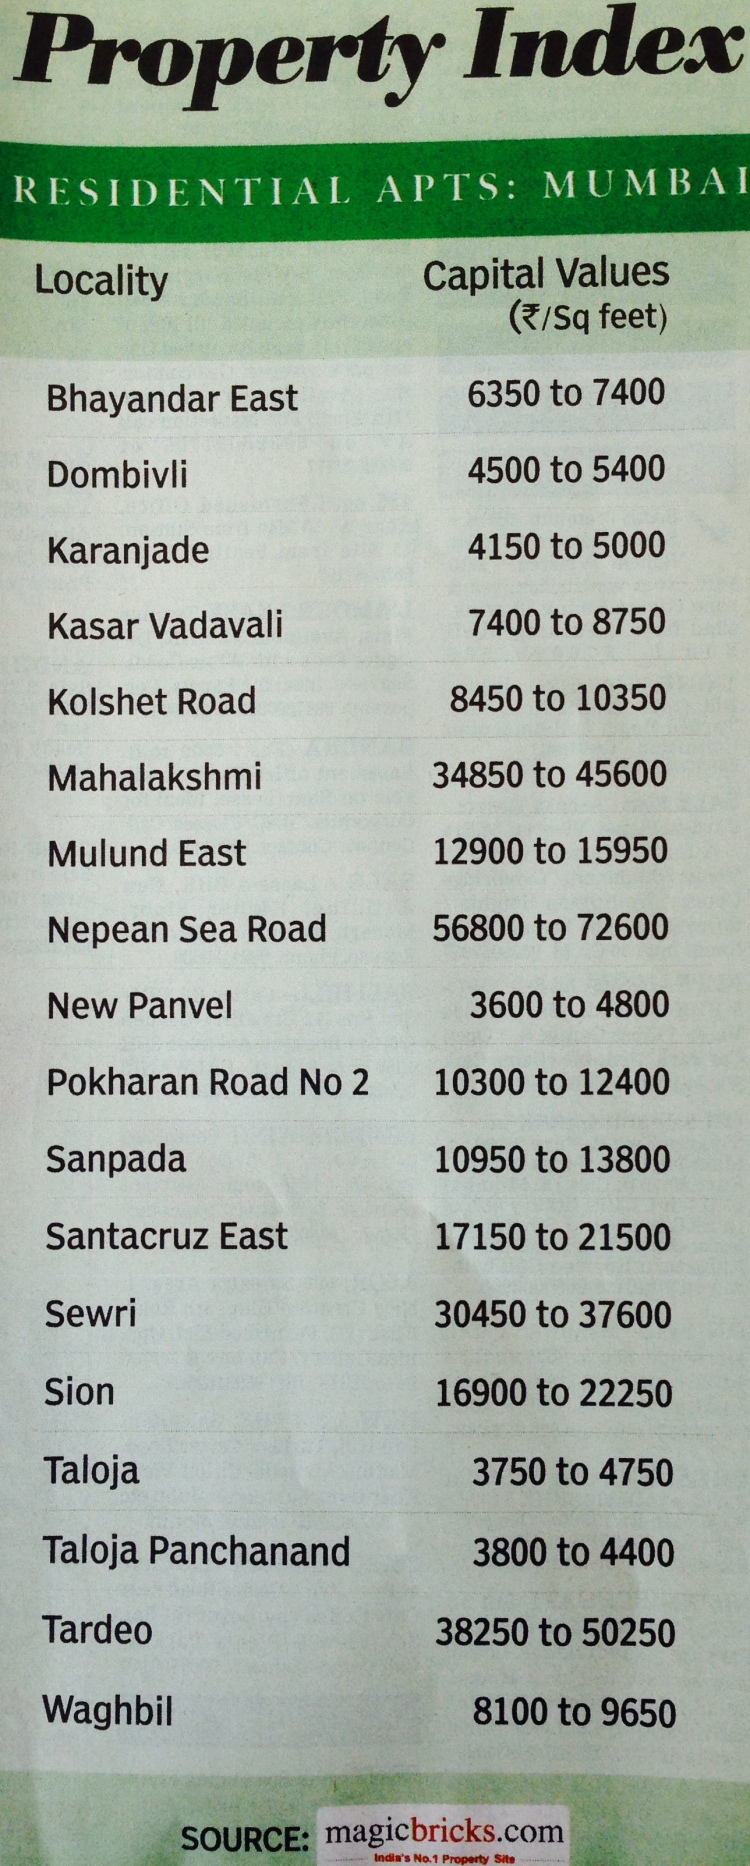
I am sure all of you have noticed the oft-published ‘real-estate’ price charts that the daily papers publish.
I have been staring at them for a long time now and have been trying to explain a thesis to my wife Chhavi to justify a real estate decision I made a few months back 🙂
Today, I decided to ‘Mapify’ that thesis (since real estate sits on a map) and decided to share it with everyone!
Check out (Click to expand and feel free to download):
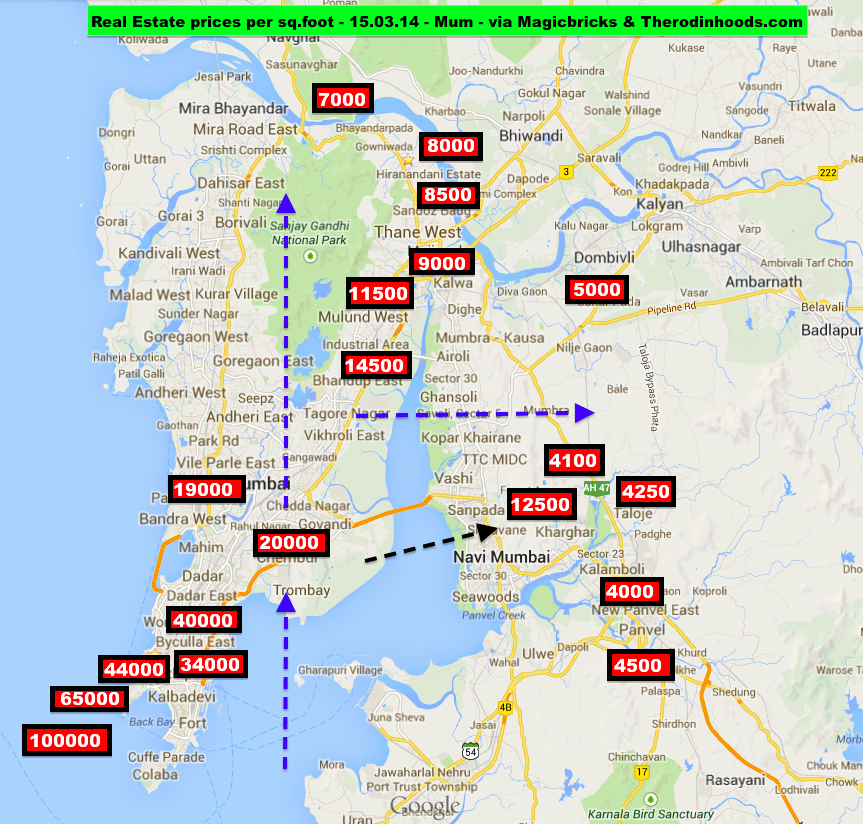
All I have done is juxtaposed the real estate prices of the report on to google maps to represent the data visually:
Now my THESIS:
Look at the bottom left of the map:
Apartments in Cuffe Parade (the southernmost tip of residential Mumbai) are routinely selling for Rs. 88,000-100,000 per square feet. The same rate applies to apartments in a building like Samudra Bhavan at Worli and many iconic buildings in Malabar Hills etc.
My theory is that the price of real estate in Mumbai gravitates from the south and radiates upwards and sideways in an pulsating fashion (slowing down as it goes farther). See the faint dotted blue arrows.
As South Mumbai continues to climb, so also other areas go up, in a ratio directly proportionate to their distance from South Mumbai.
Check the Black Arrow! It also points to a ‘hidden’ logic that the places nearest to SOBO even across the small strait of Ocean (Sanpada in this case) should be higher priced than other places!
Now, prices in South Mumbai ARE CHEAP! The ‘iconic’ addresses in Manhattan, New York and in the West End in London sell for 10 lac per sq. feet; so South Mumbai has space to creep vertically upwards, as it has done for the past 3 decades.
Using my thesis, I have placed a bet on an area directly in the direction of the pulse and I hope that pays out 🙂
The same could be used by you (at your own risk :))
Tell me what you think of my thesis, and if you disagree then don’t tell Chhavi :
Data source:

*****